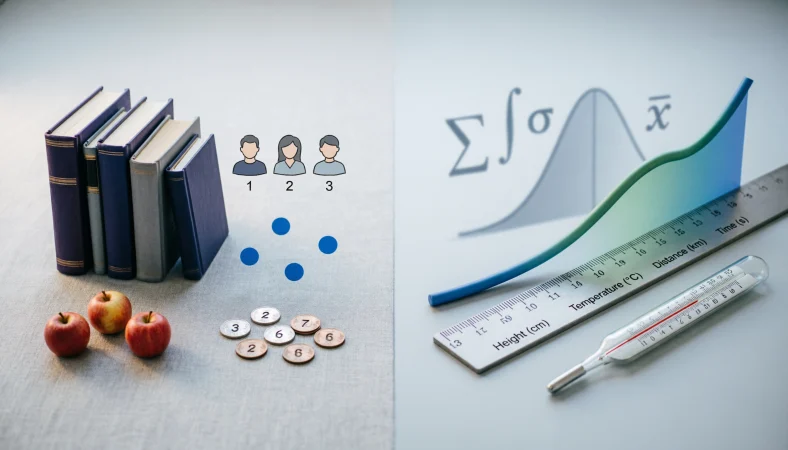
Discrete or continuous describes two different ways that data or variables can be classified. Discrete values are separate and countable, such as the number of students in a class, while continuous values can take any value within a range, such as height or temperature. Knowing the difference helps prevent mistakes in mathematics, statistics, science, and data analysis.
The question of whether something is discrete or continuous appears frequently in mathematics, statistics, science, economics, engineering, and computer science. At first, the distinction can seem technical, but the basic idea is straightforward once you understand what kind of values a variable can take.
A discrete variable has distinct, separate possible values. These values are often counted. For example, a family may have one, two, three, or four children, but it cannot normally have 2.6 children.
A continuous variable, by contrast, can take any value within a meaningful range. Height is a familiar example. A person might be 170 centimeters tall, 170.5 centimeters tall, or 170.537 centimeters tall, depending on the precision of measurement.
This difference matters because choosing the wrong classification can affect the statistical method, probability model, graph, and interpretation used in an analysis. A variable that is counted should not automatically be treated like one that is measured.
Discrete or Continuous: What’s the Difference?
The central difference concerns the possible values a variable can have.
Discrete means separate or individually distinguishable. In statistics, a discrete variable usually has countable possible outcomes. There may be a finite number of values, or the values may continue indefinitely while remaining countable.
Continuous means capable of taking any value within an interval. Continuous variables are generally associated with measurement rather than counting.
| Feature | Discrete | Continuous |
| Basic meaning | Separate and countable | Measurable across a range |
| Possible values | Distinct values | Any value within a range |
| Typical source | Counting | Measuring |
| Example | Number of books | Weight of a book |
| Decimal values | Usually not meaningful for the count itself | Often meaningful |
| Common statistical model | Discrete probability distributions | Continuous probability distributions |
| Typical graph | Individual points or bars | A curve or connected distribution |
| Measurement | Usually counted | Usually measured |
A simple way to remember the distinction is this:
Discrete data answers how many?
Continuous data often answers how much?
If you count individual objects, the result is frequently discrete.
If you measure something that can vary smoothly, the result is frequently continuous.
The important word is frequently, because real world classification sometimes requires more careful consideration.
Is Discrete or Continuous a Grammar, Vocabulary, or Usage Issue?
This is primarily a vocabulary and conceptual classification issue, rather than a grammar problem.
The words have established meanings in ordinary English, but their meanings become more precise in mathematics and statistics.
Are discrete and continuous interchangeable?
No.
Although both words can describe variables, they represent different properties.
Consider these examples:
The number of employees is discrete.
Employee working hours are continuous.
Replacing one term with the other would change the statistical meaning.
The same distinction applies to probability distributions. A discrete probability distribution assigns probabilities to individual possible outcomes. A continuous probability distribution describes probabilities over intervals.
Formal versus informal usage
Both terms are formal technical vocabulary. They are common in textbooks, research papers, statistical reports, scientific studies, and professional data analysis.
In everyday conversation, however, people may describe the distinction using simpler words.
Someone might say:
“We counted the cars.”
That strongly suggests a discrete variable.
Another person might say:
“We measured the speed of the cars.”
That suggests a continuous variable.
In formal writing, it is better to use the precise terminology when classification matters.
Academic versus casual usage
In academic work, classification should be justified rather than guessed.
For example, a research paper might identify the number of participants as a discrete variable and body mass as a continuous variable.
In casual conversation, people rarely need to use the terms explicitly. However, understanding them becomes important when reading graphs, interpreting research, or working with statistical data.
Understanding Discrete Variables
A discrete variable represents separate possible outcomes.
The number of pets owned by a household is a classic example. A household might have zero pets, one pet, two pets, or five pets. The possible values are distinct.
Other examples include:
- Number of customers entering a store
- Number of goals scored in a match
- Number of defective products
- Number of children in a family
- Number of emails received
- Number of books on a shelf
- Number of cars in a parking lot
- Number of calls received by a business
The defining feature isn’t simply that the values are written as whole numbers. The deeper issue is that the variable represents individual countable outcomes.
Workplace example
Suppose a company wants to analyze the number of customer complaints received each day.
The values could be zero, one, two, three, and so forth. A result of 4.7 complaints does not make sense when counting individual complaints.
Therefore, the number of complaints is a discrete variable.
Academic example
A researcher studying classroom performance might record the number of questions answered correctly by each student.
If a test contains 20 questions, the possible score might be zero through 20, assuming each question has one point.
The score is therefore discrete.
Technology example
A software system might record the number of failed login attempts for each account.
An account could have zero failed attempts, one failed attempt, two failed attempts, and so on.
The system is counting events, so the variable is discrete.
Usage recap
When values represent individual countable outcomes, think discrete. The possible results are separate rather than forming an uninterrupted measurement scale.
Understanding Continuous Variables
A continuous variable can take values anywhere within a specified range.
Temperature provides a useful example. Depending on the measurement system and instrument, a temperature might be 20 degrees, 20.1 degrees, 20.12 degrees, or another value within the relevant range.
Other examples include:
- Height
- Weight
- Distance
- Time
- Temperature
- Speed
- Pressure
- Volume
- Blood pressure
- Age when treated as a measured quantity
The important characteristic is that values between two observations can potentially exist.
If one object weighs 10 kilograms and another weighs 11 kilograms, there are many possible weights between those values.
Workplace example
A manufacturing company may measure the thickness of a sheet of material.
One sheet might measure 2.01 millimeters and another 2.08 millimeters. Many other measurements can exist between them.
That makes thickness a continuous variable.
Academic example
A researcher investigating human growth might record participants’ heights.
Even when a measuring device reports height to the nearest centimeter, the underlying characteristic is continuous. The rounded number reflects measurement precision, not necessarily the nature of the variable itself.
Technology example
A navigation application may track the speed of a vehicle.
Speed can change gradually. A vehicle might travel at 50 kilometers per hour, then 50.1, 50.2, and many other values.
The underlying measurement is continuous.
Usage recap
When a quantity is measured and can theoretically take values throughout an interval, it is generally continuous.
When You Should NOT Use Discrete or Continuous Interchangeably
There are several situations where careless classification causes problems.
1. Do not classify every number as discrete
A decimal number does not automatically make something continuous, and a whole number does not automatically make something discrete.
The underlying variable matters.
2. Do not assume measurement always means continuous
Some measurements are recorded in categories or fixed units. The way data is collected can affect how it is analyzed.
3. Do not classify a count as continuous merely because statistics are involved
The number of customers is still a count even if a sophisticated statistical model is being used.
4. Do not confuse numerical appearance with variable type
A continuous measurement may be rounded to a whole number. That doesn’t necessarily turn the underlying variable into a discrete one.
5. Do not use continuous to mean simply “happening often”
In ordinary English, continuous can mean ongoing. In statistics, it has a more specific mathematical meaning.
6. Do not assume all categories are discrete numerical variables
Categorical data is a separate concept. A variable such as eye color is not continuous merely because many observations are possible.
7. Do not ignore the measurement process
How a variable is defined and collected matters when deciding how to analyze it.
8. Do not choose a probability distribution before identifying the variable
The classification should help guide the statistical model rather than being selected afterward to fit the desired result.
Common Mistakes and Decision Rules
| Correct sentence | Incorrect sentence | Explanation |
| The number of employees is discrete. | The number of employees is continuous. | Employees are counted as individual people. |
| Height is continuous. | Height is discrete because it is recorded as a whole number. | Rounding does not necessarily change the underlying variable. |
| The number of defective items is discrete. | The number of defective items is continuous. | Defective items are counted. |
| Temperature is generally continuous. | Temperature is always discrete because a thermometer displays specific values. | The underlying quantity can vary across a range. |
| Travel time is continuous. | Travel time must be discrete because it is recorded in minutes. | Recording precision does not necessarily define the underlying variable. |
Decision Rule Box
If you are counting separate individual outcomes, use discrete.
If you are measuring a quantity that can take values throughout a range, use continuous.
This rule works for many introductory examples, but advanced statistical work may require additional attention to how the variable is defined and recorded.
Discrete and Continuous Data in Probability
The distinction becomes especially important in probability.
For a discrete random variable, individual outcomes can have positive probability.
Imagine rolling a standard die. The possible outcomes are one, two, three, four, five, and six.
The probability of rolling a three is:
1 divided by 6
A continuous random variable works differently.
Suppose X represents the exact height of a randomly selected person. In a continuous probability model, the probability of observing one exact mathematical value is treated differently from the probability of observing a range.
Instead of asking for the probability of one exact value, analysts usually consider an interval.
For example:
What is the probability that a person’s height is between 170 and 180 centimeters?
This distinction is fundamental to probability theory.
Discrete and Continuous Graphs
Graphs can also provide useful clues.
Discrete data is often displayed using individual bars or points. A bar chart is especially common when values represent separate counts.
Continuous data is often represented with a line, curve, histogram, or density curve, depending on the purpose of the visualization.
However, graph appearance alone should not determine classification.
A histogram can represent continuous measurements, but the data is grouped into intervals for display.
Similarly, discrete values can sometimes be displayed using a connected line for practical reasons.
Therefore, the nature of the variable comes first. The graph is a representation of the data, not the definition of the data type.
Discrete and Continuous Variables in Modern Technology and AI Tools
Modern technology produces enormous amounts of both types of data.
A website might record the number of page views. That is a count and is therefore generally discrete.
The same website might record how long each visitor stays on a page. Time is generally treated as continuous.
Artificial intelligence systems also work with both forms.
A machine learning model might predict the number of purchases a customer makes during a period. That outcome is a count.
Another model might predict house price, temperature, energy consumption, or delivery time. These are commonly modeled as continuous outcomes.
This distinction can influence the choice of statistical techniques and machine learning models.
For example, count prediction may require methods designed for discrete outcomes, while predicting a continuously varying quantity often calls for regression techniques suited to continuous targets.
The important point is that AI doesn’t eliminate the distinction. If anything, large scale automated data analysis makes accurate variable classification more important.
Etymology and Meaning
The word discrete comes from a Latin root associated with separating or distinguishing. Its modern meaning retains this central idea of things being distinct from one another.
Continuous comes from Latin roots associated with holding together or remaining connected.
The contrast is therefore reflected in the words themselves.
Discrete values are separated.
Continuous values form a connected range.
That conceptual contrast is useful because it provides a memorable way to understand the terminology without relying entirely on mathematical definitions.
An expert style explanation would be:
“The essential distinction is whether the possible values are separate outcomes or points along a measurable continuum.”
That principle applies across statistics, mathematics, science, economics, and data science.
Two Practical Case Studies
Case Study 1: Retail business
Imagine a retailer analyzing daily activity.
The company records:
Number of purchases: 850
Average purchase value: 42.75 units of currency
Customer waiting time: 3.8 minutes
The number of purchases is discrete because individual purchases are counted.
Purchase value and waiting time are generally treated as continuous because they represent measurable quantities that can vary across a range.
If the retailer mistakenly treats the number of purchases as a continuous measurement, it may select an inappropriate statistical approach.
Case Study 2: Manufacturing
A factory monitors production quality.
It records the number of defective products produced each day and the thickness of the manufactured material.
The defect count is discrete.
The thickness measurement is continuous.
Suppose the factory produces 10,000 units and records seven defective items. Seven is an individual count.
If the average material thickness is 1.75 millimeters, however, the measurement can vary across a range.
The distinction allows analysts to choose methods appropriate to each variable rather than treating all numerical data in the same way.
Error Prevention Checklist
Always use discrete when:
- You are counting individual objects.
- The possible outcomes are separate.
- Intermediate fractional counts don’t make sense.
- You are recording event counts.
- Each unit represents an individual occurrence.
Always consider continuous when:
- You are measuring a physical quantity.
- Values can vary within an interval.
- More precise measurement produces additional possible values.
- Intermediate values make meaningful sense.
- The variable naturally changes along a scale.
Never assume:
A whole number automatically means discrete.
A decimal automatically means continuous.
A measurement displayed by an instrument automatically defines the mathematical variable.
The correct classification depends on what the variable represents.
Related Grammar and Usage Confusions You Should Master
Understanding data terminology becomes easier when you also recognize other commonly confused concepts.
Quantitative or qualitative
Quantitative data represents numerical quantities, while qualitative data describes qualities or categories.
Population or sample
A population represents the complete group under study, while a sample represents a selected portion of that group.
Parameter or statistic
A parameter describes a population, while a statistic describes a sample.
Correlation or causation
Correlation describes an association between variables. Causation means that one factor produces a change in another.
Mean or median
The mean is an arithmetic average. The median is the middle value after observations are ordered.
Variance or standard deviation
Both describe variation, but they express it differently.
Probability or possibility
Possibility concerns whether something can happen. Probability quantifies how likely an event is.
Accuracy or precision
Accuracy concerns closeness to the true value, while precision concerns consistency or reproducibility.
Sample or census
A sample studies part of a population. A census attempts to collect information from the entire population.
Independent or dependent variable
An independent variable is generally the factor being manipulated or used as a predictor, while a dependent variable is the outcome being measured.
FAQs
What is the difference between discrete and continuous variables?
A discrete variable has separate, countable possible values. A continuous variable can take values throughout a range. Number of students is discrete, while height is generally continuous.
Is age discrete or continuous?
Age is generally considered continuous when it represents a person’s exact amount of time since birth. It can be recorded in years, months, days, hours, or smaller units.
Is height discrete or continuous?
Height is generally continuous because it can theoretically take any value within a relevant range. Recording height to the nearest centimeter does not necessarily change its underlying classification.
Is the number of students discrete or continuous?
The number of students is discrete because students are counted individually. A classroom can contain 20 or 21 students, but not 20.5 students.
Is temperature discrete or continuous?
Temperature is generally treated as continuous because it can take many possible values within a range. The exact treatment can depend on how the variable is defined and measured.
Is money discrete or continuous?
Money can be modeled in different ways depending on the context. A balance recorded only in whole currency units may have discrete recorded values, while the underlying economic quantity may be modeled differently. The unit and purpose of the analysis matter.
Is time discrete or continuous?
Time is generally considered continuous because it can be measured at increasingly fine levels of precision. A system that records time only in whole seconds creates discrete recorded observations, but the underlying quantity remains continuous.
What is an example of discrete data?
Examples include the number of customers, number of children, number of defective products, number of goals, and number of calls received.
What is an example of continuous data?
Examples include height, weight, temperature, distance, speed, time, and pressure.
How do I remember the difference between discrete and continuous?
Think of counting versus measuring. If you’re counting separate things, discrete is usually appropriate. If you’re measuring something that can vary across a range, continuous is usually appropriate.
Conclusion:
The distinction between discrete or continuous is fundamental to understanding statistical data. Discrete variables represent separate, countable outcomes, while continuous variables represent measurements that can take values throughout a range.
The simplest practical test is to ask what the variable represents. If you are counting individual items or events, it is generally discrete. If you are measuring a quantity that can vary smoothly, it is generally continuous.
Remember that the number displayed by a device isn’t always enough to determine the classification. A continuous measurement can be rounded to a whole number, and a discrete count can be represented numerically with sophisticated statistical software.
Once you focus on the underlying variable rather than its appearance, the distinction becomes much easier. That understanding is essential for choosing appropriate statistical methods, interpreting probability, building data models, and communicating quantitative information accurately.











1 thought on “Discrete Or Continuous: Meaning, Difference, Examples & Correct Usage For 2026”